Configuration
Data Loading
1
2
3
4
5
6
7
8
from sklearn import datasets
from sklearn.decomposition import PCA

import matplotlib
import matplotlib.pyplot as plt
%matplotlib inline
breast_cancer = datasets.load_breast_cancer()
data = breast_cancer.data
Scikit-learn 패키지를 이용해 주성분 분석을 진행한다.
Data Visualization
1
2
3
4
5
6
7
8
9
10
11
12
13
14
15
x = data[:, :2]
y = breast_cancer.target
target_names = breast_cancer.target_names


plt.figure(figsize = (7, 7))
colors = ['red', 'blue']

for color, i, target_name in zip(color, [0, 1], target_names):
  plt.scatter(x[y==i, 0], x[y==i, 1], color=color, label=target_name)

plt.legend()
plt.xlabel('Mean Radius')
plt.ylabel('Mean Texture')
plt.show()
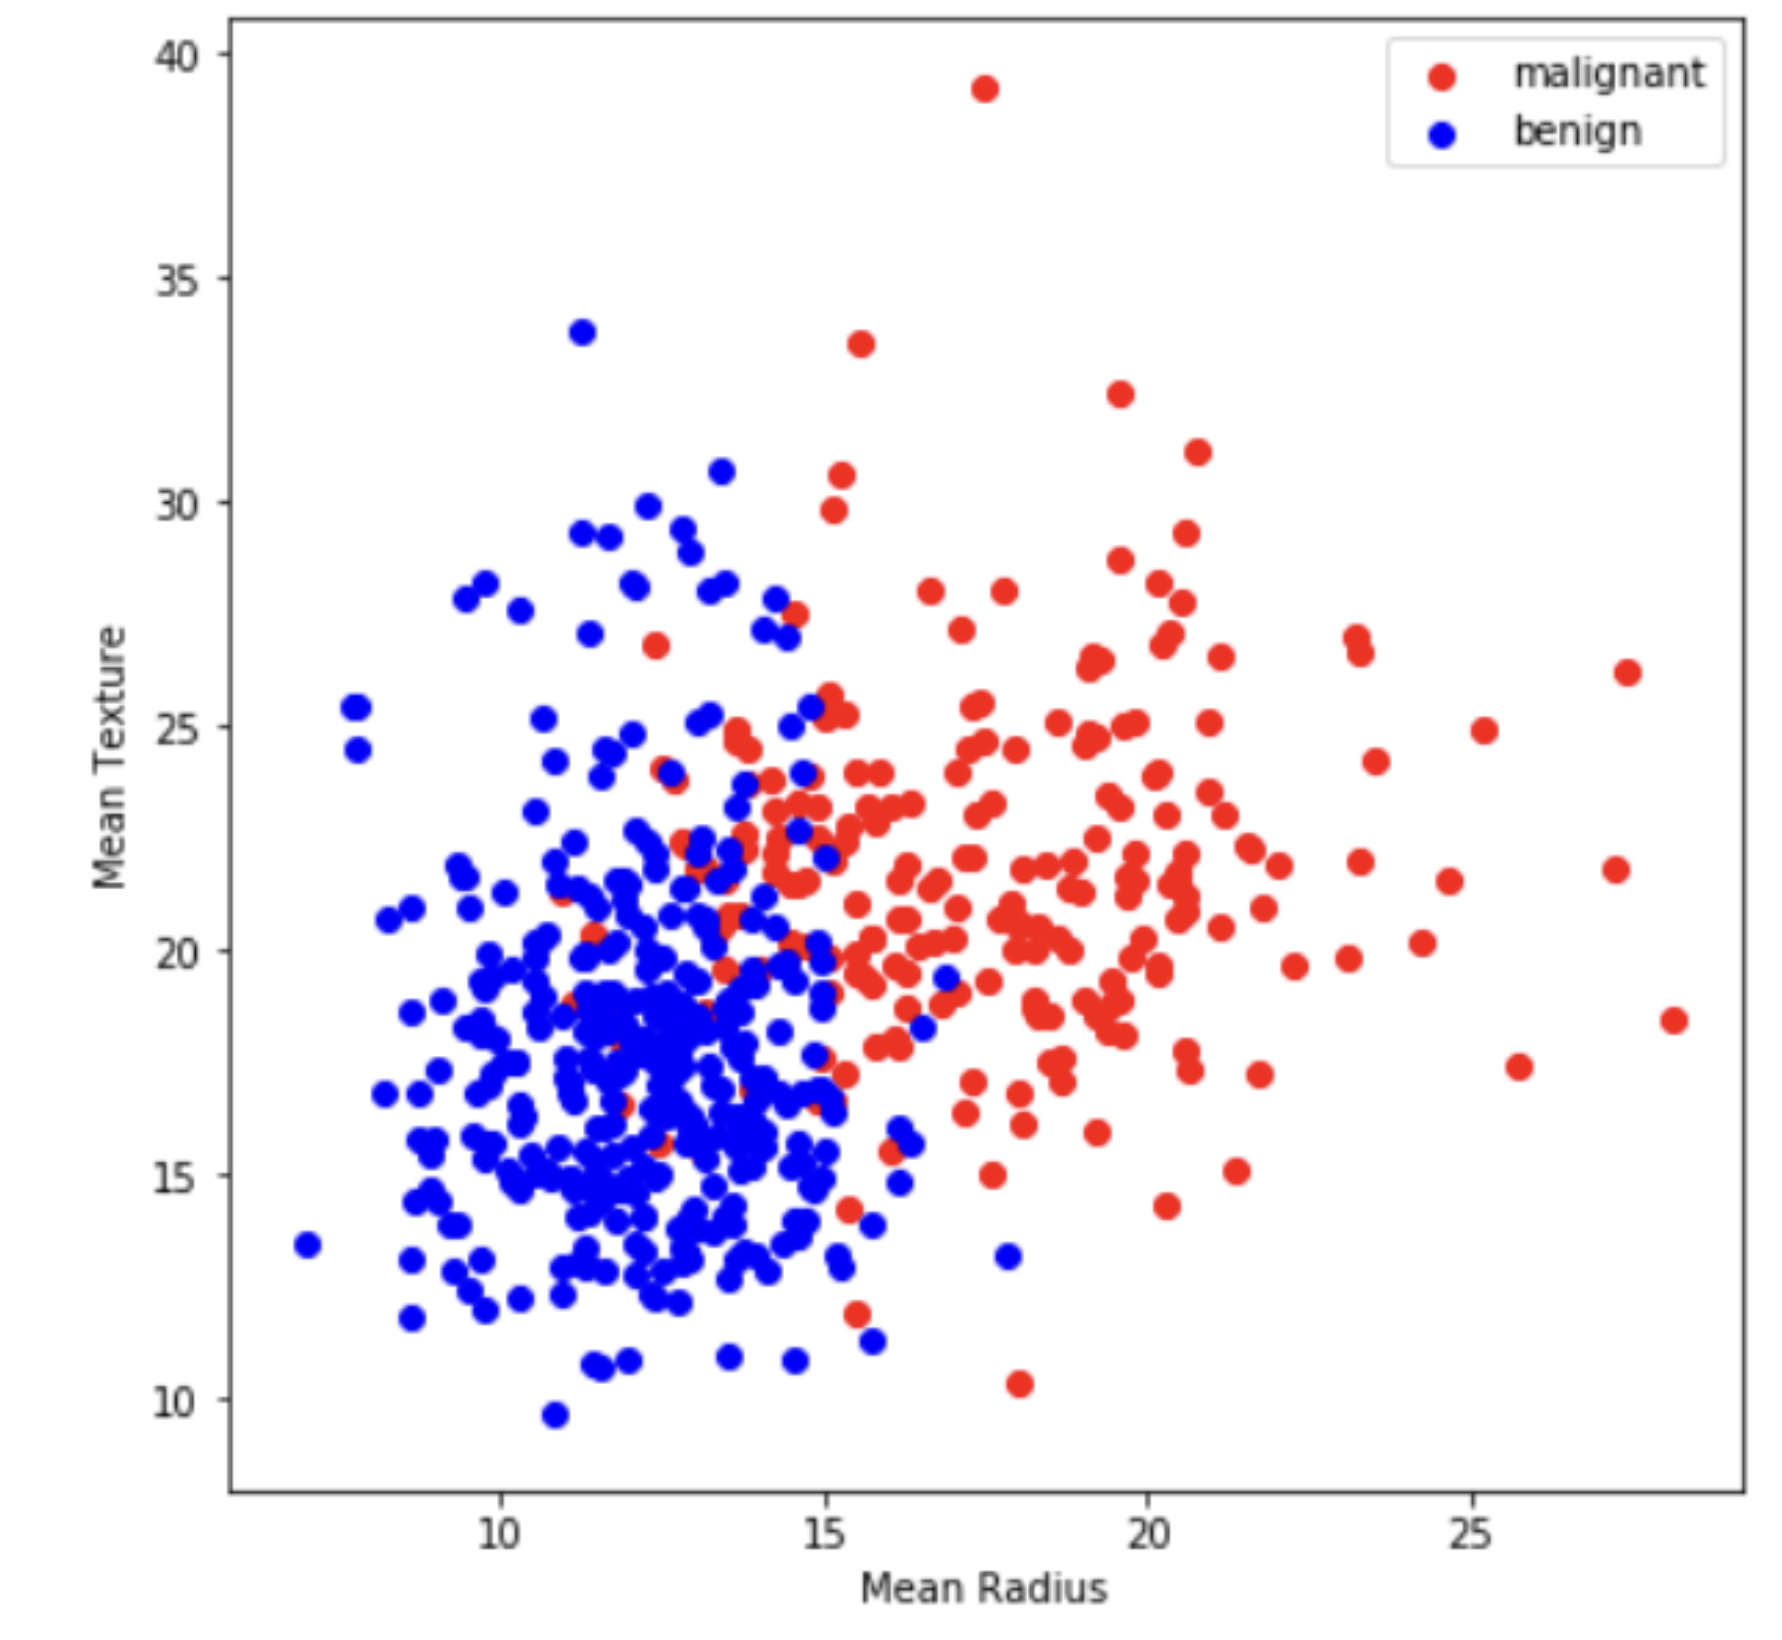
Prior to dimension reduction, only the two variables ‘malignant’ and ‘benign’ are visualized.
PCA
1
2
3
4
5
6
7
x = data
y = breast_cancer.target
target_names = breast_cancer.target_names

pca = PCA(n_components=2)
x_p = pca.fit_transform(x)
print('Variance of the Top 2 Principle Components : %s' %str(pca.explained_variance_ratio_))
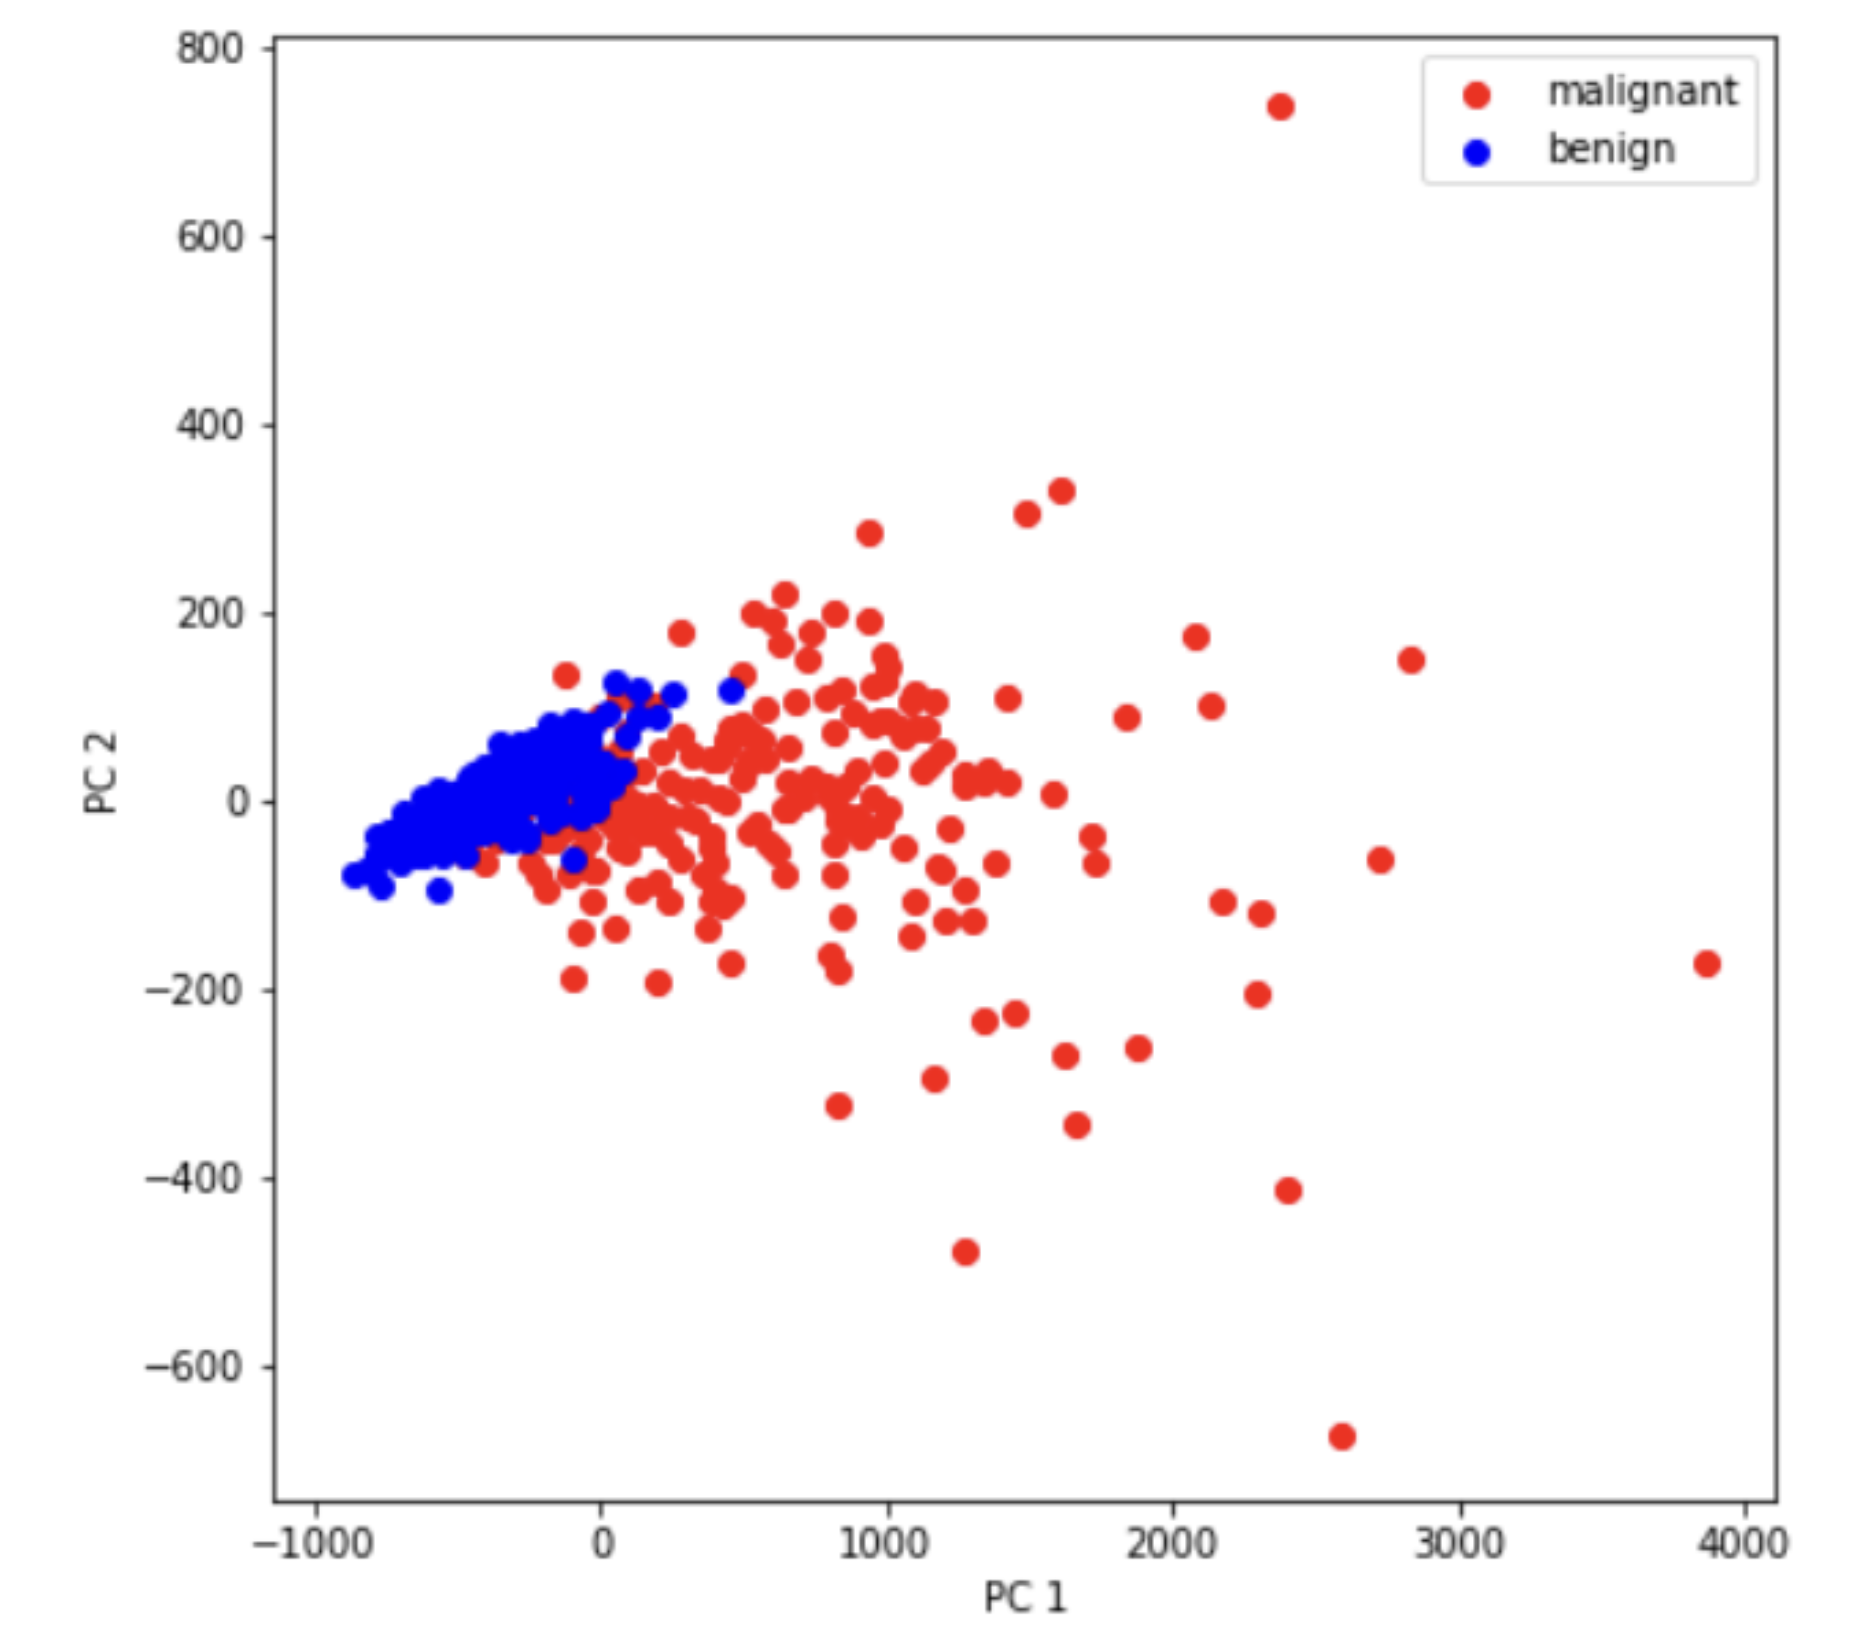
Variance of the Top 2 Principle Components : [0.98204467 0.01617649]
The PCA yields results as shown here.


